Exploring well-known path finding algorithms with SFML graphics library
In my last post I have shown a way to unify implementation of the most well-known graph-traversal algorithms. Now let's make it more visually appealing and look into the performance differences.
Intro
As someone who is not a professional game developer, I have always been curious about different concepts and enjoy exploring topics that are not directly related to my daily routine.
Throughout my career, I have often found myself working on small game projects that allow me to practice and learn various problem-solving techniques.
While I may not always finish and polish the games I work on, I have found that there is a wealth of knowledge to be gained from the process, even if the game remains incomplete. These projects have exposed me to a range of interesting challenges, including geometric calculations of polygons, state machines, sorting algorithms, rendering techniques, entity modeling, file and database manipulation, and working with various graphic libraries (such as XNA, GLUT, OpenGL, WebGL, SDL, SFML, etc.).
What I find even more fascinating is the realization that game programming concepts have applications beyond game development itself. They can intersect with many areas such as, for example, robotics and self-driving technologies.
The story behind
A few years ago, Yandex organized a contest called Robots Couriers with an enticing prize: a ticket to a closed self-driving conference for professionals. The contest resembled a game, with participants tasked with finding optimal routes on a map and optimizing delivery using robotic couriers.
As I delved into the topic, I discovered that despite route finding being a solved problem, it continued to be of interest to the professional game development community. Between 2010 and 2020, engineers made significant optimizations to the A* algorithm, particularly beneficial for AAA games with massive maps. Reading articles and research papers on these optimizations was an exciting experience.
Furthermore, the contest requirements were designed to enable easy assessment of program outputs by the contest's testing system. As a result, there was little emphasis on visualization.
I found it intriguing to explore this field and develop a small application that uses well-known graph algorithms to find routes on a grid map. To visualize my findings, I employed the SFML graphics library.
Goal
This project builds upon one of my previous endeavors, where I demonstrated that four well-known path-finding algorithms (BFS, DFS, Dijkstra's, and A*) are not fundamentally different and can be implemented in a universal way. However, it was challenging to showcase significant performance differences among these algorithms in that project.
In this article, I aim to use improved test data and design something visually exciting. While the Yandex Contest task mentioned earlier aligns well with my goals, I will not solve their specific problem here since it heavily relies on their test system, which is currently unavailable.
Instead, I will extract general ideas for input parameters from that contest and create my own implementation.
Imaginary world
Imagine a technically advanced and innovative city where the future has arrived long ago. In this city, the majority of orders are delivered by courier robots, and it has become a rarity for a person to deliver an order from a cafe. In this task, we invite you to participate in finding optimal routes to deliver orders efficiently.
Let's envision the city as an N × N map. For simplicity, we assume that each robot occupies exactly one cell, and each cell can either be passable or not for the robots. In one step, a robot can move in any of the four cardinal directions (up, down, left, or right) if the target cell is free.
And I'm ignoring the rest of orginial task:At the beginning of the test, you need to output the number of robots you want to use to deliver orders and their initial coordinates. The construction of each robot will cost Costc rubles.
Next, T iterations of the simulation will be performed. One iteration represents one virtual minute and consists of 60 seconds. At each iteration, your program will be given the number of new orders, and in response, the program should tell you what actions each robot performs (60 actions per robot).
For each successfully delivered order, you will receive max(0, MaxTips - DeliveryTime) dollars in tips, where MaxTips is the maximum number of tips for one order, and DeliveryTime is the time from the moment the order appeared to its delivery in seconds.
The total number of points that you earn in one test is calculated by the formula TotalTips - R × Costc, where TotalTips is the total number of tips earned, R is the number of robots used, Costc is the cost of building one robot. The Costc and MaxTips values are set in each test. If you earned less tips than you spent on making robots, your total points will be 0. You will also receive 0 points for the test if you perform any incorrect action.
Input
The program uses standard input to read the parameters. This approach allows us to specify test data of various complexities using input files.
The first line of input contains three natural numbers: N (the size of the city map), MaxTips (the maximum number of tips per order), and Costc (the cost of building one robot). I ignore both MaxTips and Costc parameters for my first implementation and maybe will consider that in future.
Following that, each of the next N lines contains N characters representing the city map. Each string can consist of two types of characters:
'#' - indicates a cell occupied by an obstacle.
'.' - indicates a free space.
Next, you will be provided with two natural numbers: T and D (T ≤ 100,000, D ≤ 10,000,000). T represents the number of interaction iterations, and D represents the total number of orders.
Output
Your task is to visualize the map and the optimal routes using the SFML graphics library.
Modelling the maps
I'm fun of maps represented as a grid of cells. Thus, I prefer to render all the results and map itself as a grid on cell by cell basis.
There is also option to execute path search right on grid without using any additional data structure (and I have implemented this as well for the learning purposes: see in code).
But because of a grid, it is easy to represent map as a graph using one way or other. I prefer to use adjacency list of cells for most of the algorithms like BFS, Dijkstra's and A-Star. For algorithms like Bellman-Ford it may make sense to use Edges List instead of Adjacency List. That's why if you explore the codebase then you will find all of it and they all are working examples.
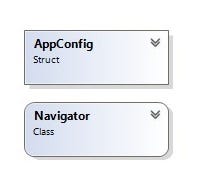
To split the logic and responsibility I have a Navigator entity that is responsible for executing path finding according to the orders and tasks configuration that is specified via AppConfig file and related map files.
App Config looks like this:
{
    "font": "../../data/arial.ttf",
    "map": "../../data/maps/test_29_yandex_weighten_real_map",
    "shadow": false,
    "map_": "../../data/maps/test_08_low_res_simple_map",
    "map__": "../../data/maps/test_10",
    "map___": "../../data/maps/test_07_partially_blocked_map",
    ...
Note, that "map_", "map__", etc. are not really configuration properties. They are ignored during application run. Since there is no way to comment part of JSON file, I use underline in the property name so it can stay in config file, but not used.
Map file looks like this:
25 50 150
#########################
#########################
#########################
###.......#####.......###
###.......#####.......###
###.......#####.......###
###...................###
###.......#####.......###
###.......#####.......###
###...................###
######.###########.######
######.###########.######
######.###########.######
###.......#####.......###
###.......#####.......###
###.......#####.......###
###.......#####.......###
###.......#####.......###
###.......#####.......###
###.......#####.......###
######.###########.######
#########################
#########################
#########################
#########################
2 4
2
6 6 4 20
This is one of the simplest examples that contain either blocked or not blocked cells. I have prepared a lot of various examples of input parameters and test data. Starting from very small parts that let you to debug and learn the code, finishing by a huge piece of map (from the real existing city) that allow us to measure the performance of a Graph algorithm.
How do we draw maps
When map contains only cells with binary state (either blocked or non-blocked), this basically means that any edge of a graph either exists or not.
To find a path in the graph we have to represent it efficiently. Like in my previous post, I have used adjacency list with the relationship as Vector[NodeId]->points to->Vector[Neighbour Nodes]:
typedef std::vector<std::vector<std::shared_ptr<Cell>>> Graph;Interestingly enough, when we exploring grids it's not really necessary to use graphs at all. We are capable to traverse grid using BFS/DFS algorithms cell by cell without thinking about edges. See method _GetPathByBFSOnGrid.
First, initialization code reads the file and converts it into the grid row by row and column by column:
bool RectangularMap::LoadMap(const std::string& filepath, bool shadow)
{
...
  // Fill the grid.
  _verticesNumber = 0;
  for (int row = 0; row < _height; row++)
  {
    ...
    for (int col = 0; col < _width; col++)
    {
      int x = col;
      int y = row;
      if (line[col] == BLOCK_CELL)
      {
        // Create a shared pointer to safely pass pointers between the classes.
        _grid[row][col] = std::make_shared<Cell>(x, y, line[col],
          blockColor, shadow, _scaleFactor);
      }
      else
      {
        ...
      }
    }
  }

  // Make a graph
  InitialiseGraph();
...
}
Then, it creates an actual graph as an adjacency list:
void RectangularMap::InitialiseGraph()
{
  MapBase::InitialiseGraph();
  ...
  unordered_set<int> visited;

  for (int rr = 0; rr < _grid.size(); rr++)
  {
    for (int cc = 0; cc < _grid[rr].size(); cc++)
    {
      if (_grid[rr][cc]->GetId() > -1)
      {
        for (int i = 0; i < 4; i++)
        {
          int r = rr + dr[i];
          int c = cc + dc[i];

          if (r >= 0 && c >= 0 && r < _width && c < _height &&
              _grid[r][c]->GetId() > -1)
          {
            if (_isNegativeWeighten)
            {
              ...
            }
            else
            {
              _adjacencyList[_grid[rr][cc]->GetId()].push_back(_grid[r][c]);
            }
          }
        }
      }
    }
  }
}
Grid represenation is useful to draw on screen using SFML library. We can draw by creating a geometric objects (this is exactly what I do for small maps):
...
for (int j = _visibleTopLeftY; j < _visibleBottomRightY; j++)
{
  for (int i = _visibleTopLeftX; i < _visibleBottomRightX; i++)
  {
    _grid[j][i]->Draw(_window, _scaleFactor);
  }
}
...
sf::RectangleShape tile;
tile.setSize(sf::Vector2f(_cellSize - 5, _cellSize - 5));
tile.setPosition(sf::Vector2f(_x * _cellSize, _y * _cellSize));
tile.setFillColor(_color);
window.draw(tile);
Or we can do it efficiently pixel by pixel for larger maps:
sf::Uint8* pixels = new sf::Uint8[_width * _height * 4];

for (int j = _visibleTopLeftY; j < _visibleBottomRightY; j++)
{
  for (int i = _visibleTopLeftX; i < _visibleBottomRightX; i++)
  {
    int index = (_grid[j][i]->GetY() * _width + _grid[j][i]->GetX());

    sf::Color color = _grid[j][i]->GetColor();
    pixels[index * 4] = color.r;
    pixels[index * 4 + 1] = color.g;
    pixels[index * 4 + 2] = color.b;
    pixels[index * 4 + 3] = color.a;
  }
}

sf::Texture texture;
texture.create(_width, _height);
texture.update(pixels);
sf::Sprite sprite;
sprite.setTexture(texture);
sprite.setScale(cellSize, cellSize);
_window.draw(sprite);
Finally, let's see how a map defined by file test_25_xmax would look like.
Originally, file defines this:
..............C.................
..............#.................
.............###................
............#####...............
...........#######..............
..........##1###2##.............
.........###########............
........##3######4###...........
.......###############..........
......#################.........
.....###################........
....#####################.......
.............###................
.............###................
.............###................
And a map renderred with SFML looks like this:
Because I wanted all of that to be controlled by user with keyboard, I left all the user-behavior logic in the main.cpp. I like to call it “Controller” logic.
SFML library makes it very easy to handle keyboard events:
while (window.isOpen())
{
  Event event;
  while (window.pollEvent(event))
  {
    if (event.type == Event::Closed)
      window.close();

    if (event.type == Event::KeyPressed && event.key.code == Keyboard::Space)
    {
      ... Do what you need here
    }
  }
}
The main idea is user triggers (press of a SPACE button) reading the map file and renderring the map, and then by a second trigger (second press of a SPACE button) to load routing task and calculate the shortest path between two points on map:
...
if (navigator->IsReady())
{
  navigator->Navigate(); // Finding route between two points
}
else
{
  if (map->IsReady()) // Second SPACE press runs the routing
  {
	skipReRendering = true;
	if (navigator->LoadTasks(filepath))
	{
	  navigator->SetMap(map);
	}
  }
  else // Load and draw map
  {
	drawLoading(window, font);
	if (!map->LoadMap(filepath, shadowed))
	{
	  return 0;
	}
	drawProcessing(window, font);
  }
}
...
We need to go deeper
I wanted to play with more Graph algorithms, and they all have their limitations, so I decided to implement also a multi-color maps that can be represented by multi-weighted graphs.
Every cell is colored and the color means that edge not only exists, but also applies some weight (or fee, or fine, you name it). So, edge might be blocked, half blocked, not blocked, ... you got the idea.
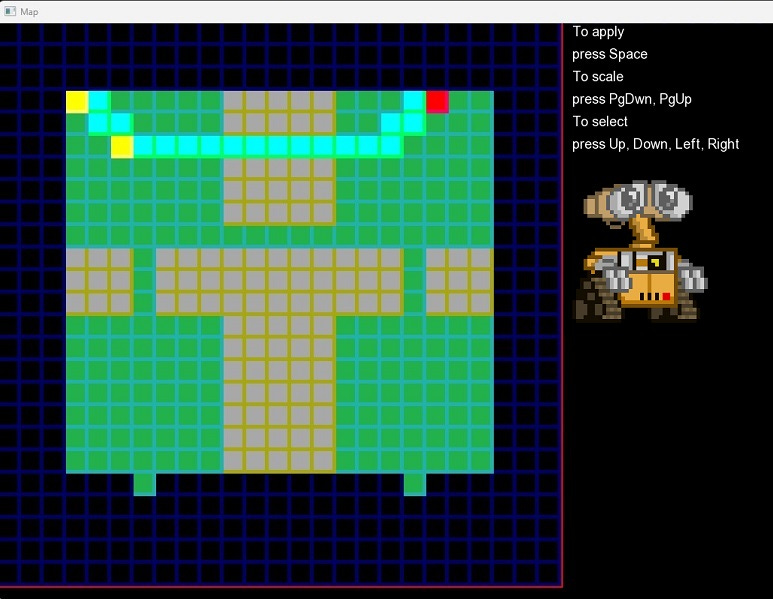
Thus, I have implemented multi-color maps that look more joyful and look like a game-ready (example from file test_31_multi_weight_graph_map):
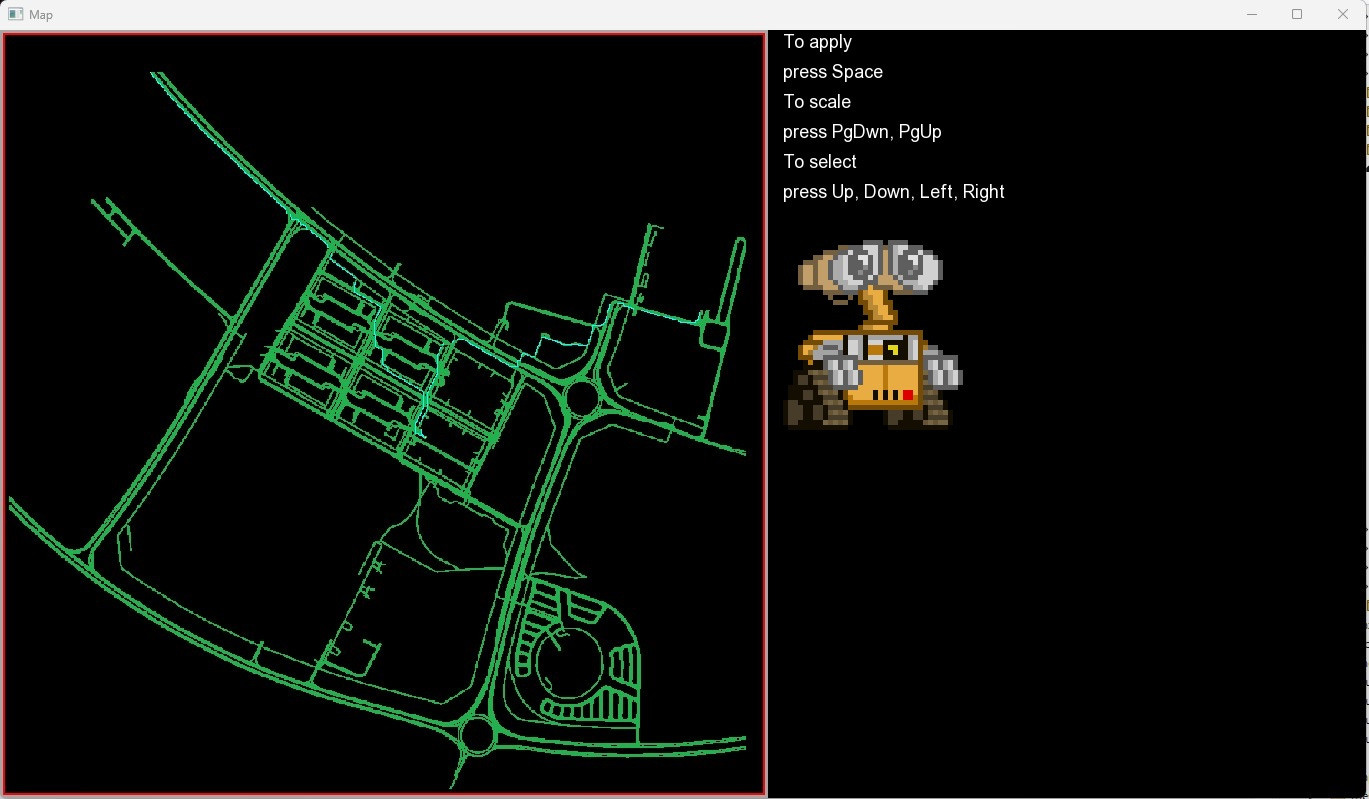
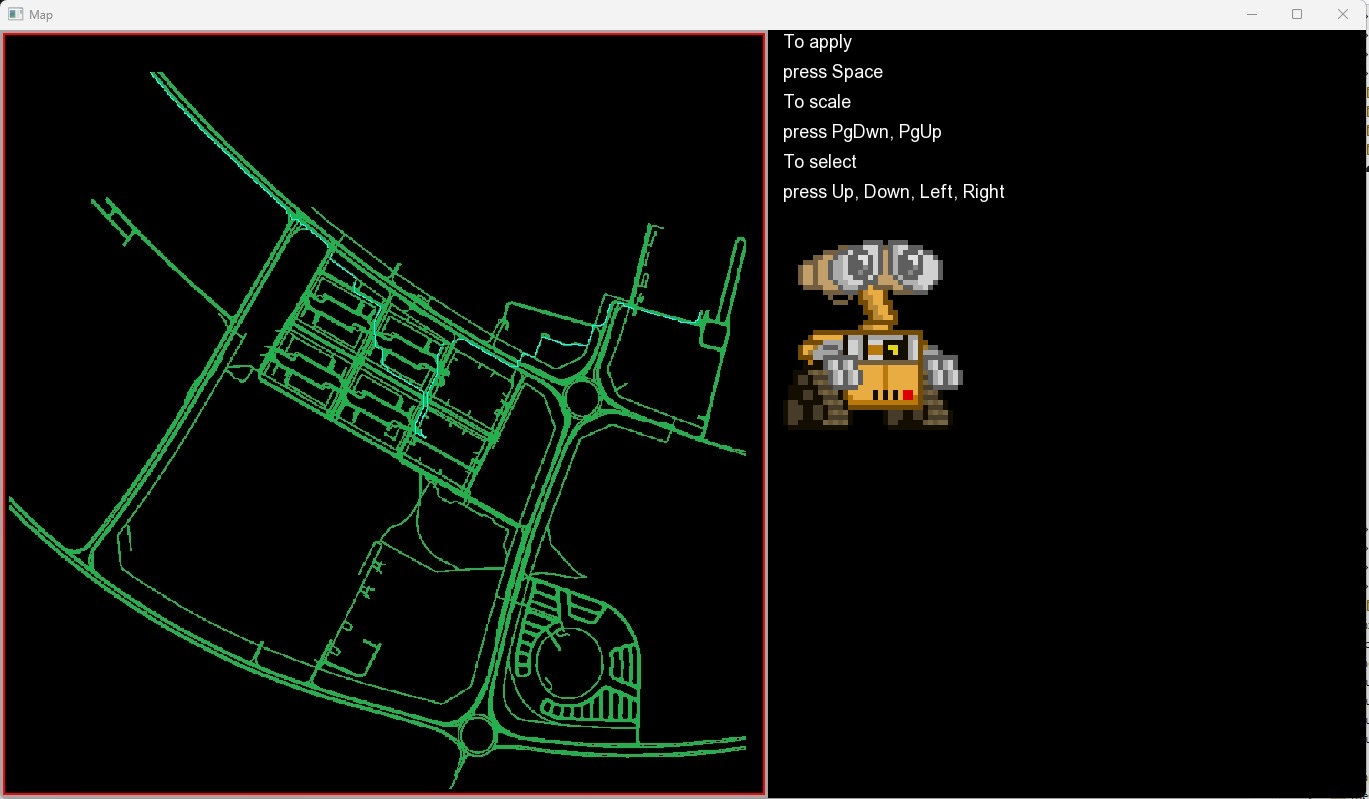
Some of the configuration files contain more complex maps from really existing cities, like test_29_yandex_weighten_real_map:
As a challenge, now we should handle maps with very flexible configuration. RectangularMap.cpp essentially contains a lot of logic inside, including all the graph algorithms and even more than needed (because I like to play with things, even if it's not particularly useful for now).
I have implemented BFS#Line 598, Dijkstra#Line 299, A-Star#Line 356, Bellman-Ford#Line 428 algorithms and a number of additional "utility" algorithms like Topological Sort, Single Source Path, that are not useful for the current application state (because they work on Directly Acyclic Graphs, which are not type of Graphs I currently use), but I have some ideas to use it in future improvements.
I didn't polish all the code and didn't get it ideal enough, but it allows me (and, I hope, will allow you) to play with the code and compare performance metrics.
Sorry about some commented lines there and there, maybe some dirty code...it's all way of learning :). To grasp an idea what's inside, I recommend you to review the RectangularMap.h.
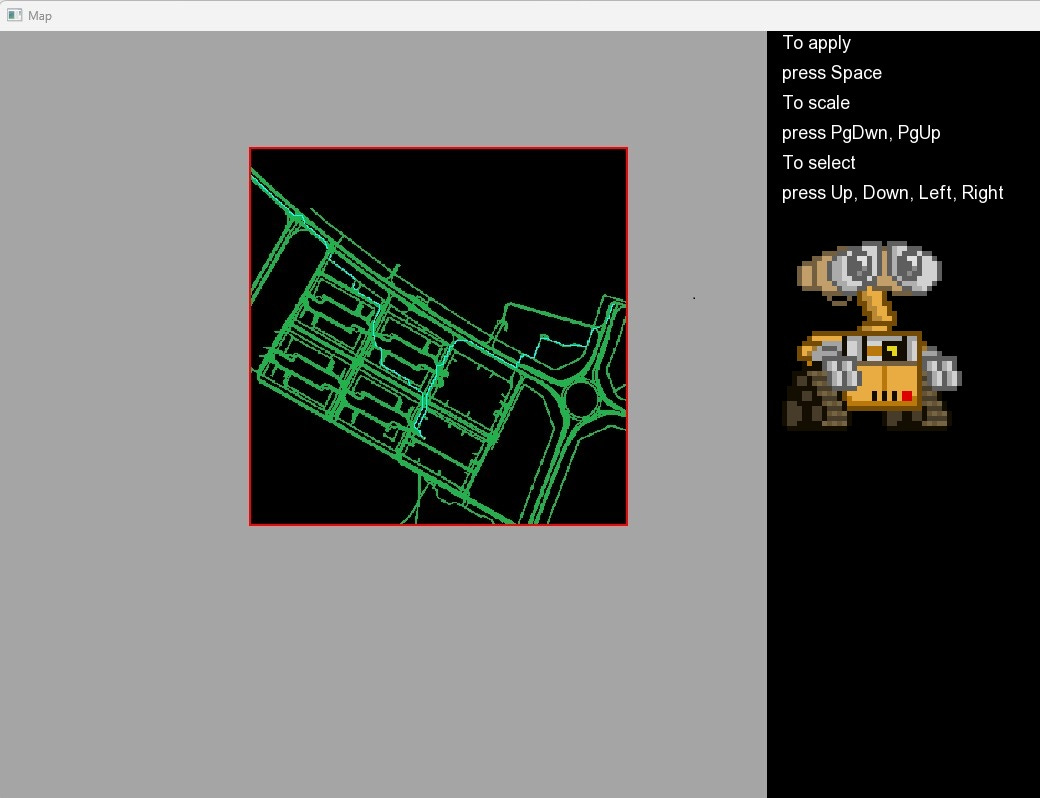
There is also some fun features like a Focus feature that allows to render only particular part of a map. It changes focus by re-rendering the necessary part using Observer pattern when user presses the PgDown or PgUp buttons. It is pretty easy to improve this feature and implement "Zoom" functionality. Take it as a home work, if you like it.
Focus feature with map file test_29_yandex_weighten_real_map in work:
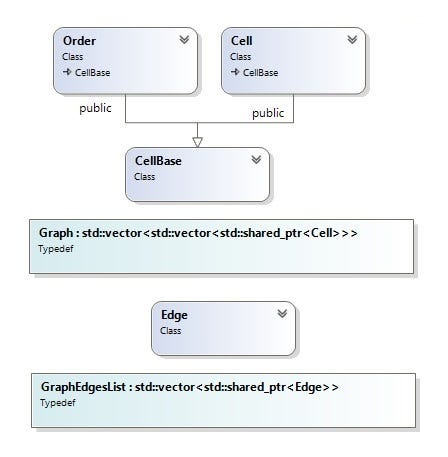
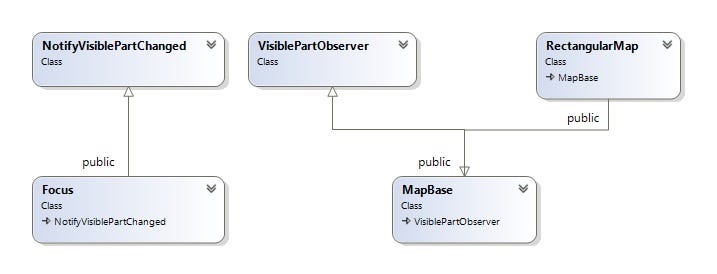
Classes diagram looks like this:
Run and play
I believe, the most joyful part is just running this little application, playing with variations of its configuration and algorithms. You can do a lot of experiments by using various map files as input parameters with different test data as well as change the logic in the code.
After start you need to press SPACE an application will render map according to the configuration file and it makes a lot of sense to start exploring from simplest test cases moving forward to the most complex one.
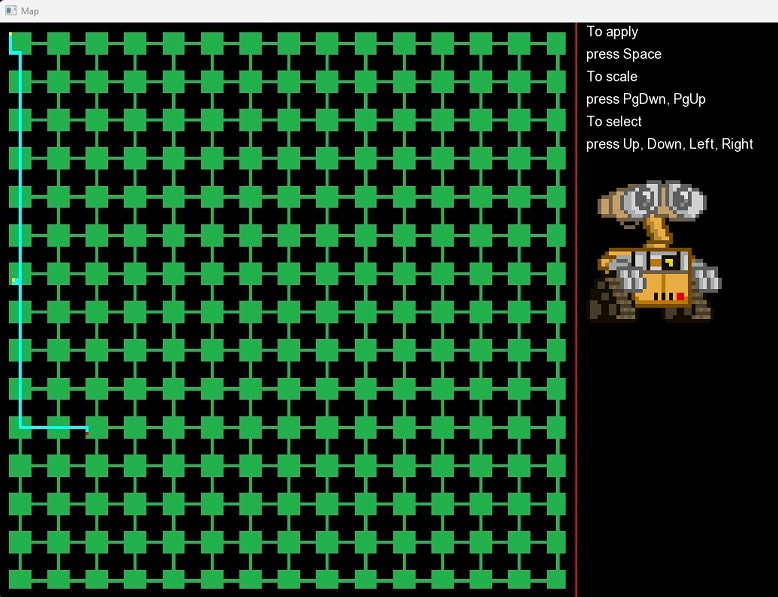
Pressing SPACE one more time executes the routing algorithms and finds path between the start and one nearest order. BTW It's not yet done, but it is easy to implement reading all the rest of orders available in map configuration files and execute path finding to all of them.
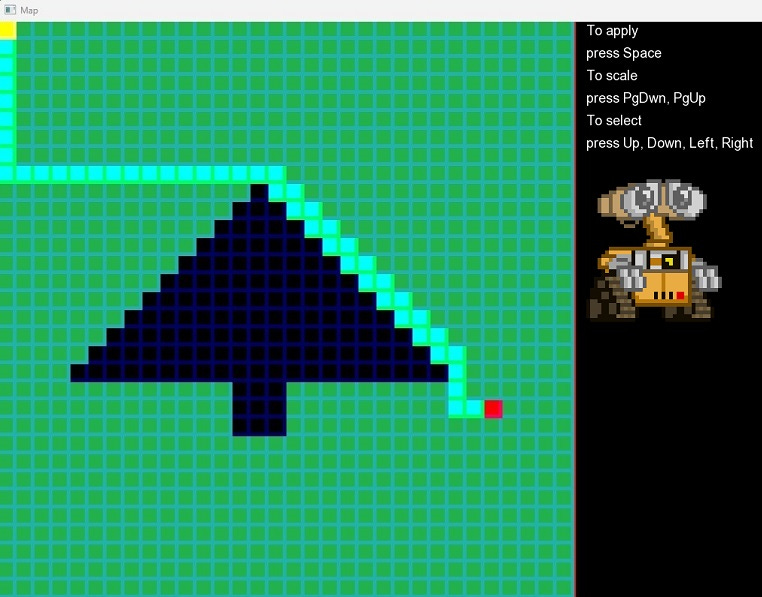
Here is route found on map defined by file test_18_yandex_super_high_res:
It also capable to find routes in the maps that are simulating existing cities, like test_29_yandex_weighten_real_map:
Finding efficient paths between two coordinates becomes challenging for algorithms like BFS, but can be easily done by A-star.
Based on the cells found in the map configuration files, application will treat map as a weighted or non-weighted graph and will select the right algorithm for it (and you can easily change this as well). It's easy to see the difference between BFS and A-Star performance:
Final words
With this I want to leave you alone and let you play with these code examples. I hope you will find it fascinating and will learn a lot from it.
Stay tuned!
Links
Help me to become better
Please, answer to a small poll to let me improve the content


